Page 50 - RSE - Results of the Apollon Project
P. 50
Results of the APolloN PRoject ANd coNceNtRAtiNg PhotovoltAic PeRsPective
APOLLON Progress on dC/dC Control
The proposed topology incorporates a DC-DC converter for each single CPV module. This converter is power
supplied directly from the corresponding CPV panel. The output of each DC-DC converter is connected in series
with the next one. And the output bus is connected to a PowerLine Communication (PLC) system allowing the
communication with a control unit and to an inverter in order to inject the generated power into the grid.
The electronic consists in a DC-DC converter tracking the maximum power point (MPP) of every CPV module.
Thus, any problem with local MPP and mismatching losses disappear or is remarkably reduced, obtaining most of
all the available power in the CPV generator at any moment.
Additionally, the device includes monitoring and communication functions to inform about its instantaneous
performance. All this CPV generator monitoring information can be gathered and analysed by a centralized control
unit. Thus, a PLC system has been designed to allow this communication between the CPV modules and a central
control unit.
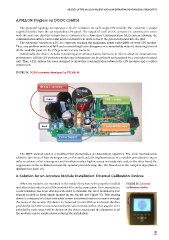
FiguRE 54. DC/DC converter developed by TECNALIA
The MPPT method used is a modifed P&O (Perturbation & Observation) algorithm. The main improvements
added to the classical P&O technique are, on the one hand, the implementation of a variable perturbation step in
order to achieve a fast convergence and simultaneously a high accuracy in steady state and, on the other hand, the
suppression of the oscillation around the optimal point detecting this. The fowchart of the complete algorithm is
displayed in Figure 56).
A Solution for an Accurate Module installation: External Calibration devices
When the modules are mounted in the tracker they have to be properly installed FiguRE 55. External
and adjusted in order to get all the modules to be on the same plane. As a consequence, calibration device
a new hardware has been developed in order to visualize the error provided by PSD
sensors located in every single module in the tracker (see Figure 55). This reading
device is composed of a black and white screen and several buttons to search through
the menu of the system. The device is connected to a RS-485 bus and reads the data
provided by each PSD sensor connected to the aforementioned bus. This way, the error
provided by each sensor will be shown on the device screen and the alignment of all
the modules can be easily achieved during the installation.
49