Page 52 - RSE - Results of the Apollon Project
P. 52
52 Results of the APOLLON project and Concentrating Photovoltaic perspective
PSD sensors have been integrated in two ASSE mini modules and several experimental test sessions have been
performed to check the tracking accuracy (see Figure 57). Hereafter the results of a typical test performed on a full
day is reported.
The I-V curve of one module and the misalignment errors measured by both PSD sensors have been logged with a
sample time of 30s. Only one PSD sensor has been used for the closed loop tracker control. During the test-day the
misalignments between the planes of the two PSDs has been under 0.04°.
Experimental Results on PSD PSD1 Module1 Module2 PSD2
Results of the APolloN PRoject ANd coNceNtRAtiNg PhotovoltAic PeRsPective
Figure 57. Apollon (ASSE) modules installed on the solar tracker with integrated PSD sensors.
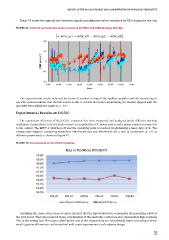
Figure 58 shows the azimuth and elevation angular misalignment values measured by PSDs during the test-day
In Figure 58, the azimuth and elevation angular misalignment values measured by PSDs during the test-day are
showed.
FiguRE 58. Azimuth and elevation errors measured by PSD1 and PSD2 during a test-day
error_az1 error_el1 error_az2 error_el2
0.2
0.1
PSD error (° ) 0
-0.1
-0.2
9:00 10:00 11:00 12:00 13:00 14:00 15:00 16:00 17:00
time
Figure 58. Azimuth and elevation errors measured by PSD1 and PSD2 during a test-day.
The experimental results achieved by means of outdoor testing of the Apollon modules and the monitoring of
two PSD sensors indicate that the PSD sensor is able to control the tracker maintaining the module aligned with the
Sun with error within the range of +/- 0.1°.
The experimental results carried out by the outdoor testing of the Apollon modules and the monitoring of two PSD
sensors indicate that the PSD sensor is able to control the tracker maintaining the module aligned to the Sun with
Experimental Results on dC/dC
error within the range of +/- 0.1°.
The conversion effciency of the DC/DC converter has been measured and analysed under different working
conditions. During these tests, the buck converter is supplied by a DC power source and a power resistor is connected
to the output. The MPPT is switched off and the operating point is reached programming a fxed duty cycle. The
comparative diagram comparing theoretical effciencies and real effciencies for a rate of conversion of 1.27 at
different power loads is shown in Figure 59.
FiguRE 59. Performances of the DC/DC converter
REAL vs thEORiCAL EFFiCiENCY
Analyzing the cause of the losses it can be inferred that the input inductor is responsible for generating a 46% of
the total losses. The losses induced by the consumption of the electronic control are also considerably high, reaching
28% of the energy loss. The losses added by the rest of the components are considerably lower. According to these
results, greater effciencies can be reached with some improvements on hardware design.
51
PSD sensors have been integrated in two ASSE mini modules and several experimental test sessions have been
performed to check the tracking accuracy (see Figure 57). Hereafter the results of a typical test performed on a full
day is reported.
The I-V curve of one module and the misalignment errors measured by both PSD sensors have been logged with a
sample time of 30s. Only one PSD sensor has been used for the closed loop tracker control. During the test-day the
misalignments between the planes of the two PSDs has been under 0.04°.
Experimental Results on PSD PSD1 Module1 Module2 PSD2
Results of the APolloN PRoject ANd coNceNtRAtiNg PhotovoltAic PeRsPective
Figure 57. Apollon (ASSE) modules installed on the solar tracker with integrated PSD sensors.
Figure 58 shows the azimuth and elevation angular misalignment values measured by PSDs during the test-day
In Figure 58, the azimuth and elevation angular misalignment values measured by PSDs during the test-day are
showed.
FiguRE 58. Azimuth and elevation errors measured by PSD1 and PSD2 during a test-day
error_az1 error_el1 error_az2 error_el2
0.2
0.1
PSD error (° ) 0
-0.1
-0.2
9:00 10:00 11:00 12:00 13:00 14:00 15:00 16:00 17:00
time
Figure 58. Azimuth and elevation errors measured by PSD1 and PSD2 during a test-day.
The experimental results achieved by means of outdoor testing of the Apollon modules and the monitoring of
two PSD sensors indicate that the PSD sensor is able to control the tracker maintaining the module aligned with the
Sun with error within the range of +/- 0.1°.
The experimental results carried out by the outdoor testing of the Apollon modules and the monitoring of two PSD
sensors indicate that the PSD sensor is able to control the tracker maintaining the module aligned to the Sun with
Experimental Results on dC/dC
error within the range of +/- 0.1°.
The conversion effciency of the DC/DC converter has been measured and analysed under different working
conditions. During these tests, the buck converter is supplied by a DC power source and a power resistor is connected
to the output. The MPPT is switched off and the operating point is reached programming a fxed duty cycle. The
comparative diagram comparing theoretical effciencies and real effciencies for a rate of conversion of 1.27 at
different power loads is shown in Figure 59.
FiguRE 59. Performances of the DC/DC converter
REAL vs thEORiCAL EFFiCiENCY
Analyzing the cause of the losses it can be inferred that the input inductor is responsible for generating a 46% of
the total losses. The losses induced by the consumption of the electronic control are also considerably high, reaching
28% of the energy loss. The losses added by the rest of the components are considerably lower. According to these
results, greater effciencies can be reached with some improvements on hardware design.
51