Page 76 - RSE - Results of the Apollon Project
P. 76
Results of the APolloN PRoject ANd coNceNtRAtiNg PhotovoltAic PeRsPective
tABLE 11. Breakdown of the life cycle cumulative energy demand (CED) and global warming potential (GWP)
for the 80-module CPV assembly (*values taken or extrapolated from Note 32)
80-MOduLE ASSEMBLY WEight (Kg) CEd (Mj) gWP (Kg CO 2 EQ)
Extended Unit Receiver (2560) 583 35,335 2,050
Triple Junction Cell (2560) 1.3 272 12
Receiver Assembly (80) 1,011 68,741 1,803
Structure (80) 1,544 72,162 4,455
80 Module total 3,139 176,239 8,308
Foundation 752 9,582 624
Column 545 12,701 794
Rotor 1,140 26,349 1,649
Motor (13 kg)* 13 1,671 92
Torsion Tube 1,100 25,425 1,591
Frame 1,000 23,113 1,446
Controller* 18 8,907 500
tracker total 4,568 107,748 6,696
Inverter (25kW) 12,864 698
Assembly/Installation 140 10
Operation/maintenance* 37,980 976
Transportation 8,713 513
End-of-life* 3,343 103
tOtAL 7,707 523,538 25,623
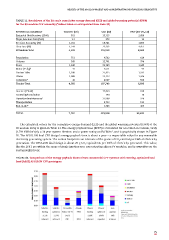
The calculated values for the cumulative energy demand (CED) and the global warming potential (GWP) of the
80 module array is given in Table 11. The energy payback time (EPBT) is calculated for a location in Catania, Sicily
2
(1,794 kWh/m /yr), a 30 year system lifetime, and a power rating at 850 W/m , and is graphically shown in Figure
2
85. The APOLLON fnal CPV design’s energy payback time is about a year – a respectable value for any renewable
electricity generating system. The carbon footprint is an estimate of the grams of CO emitted per kWh of electricity
2
generation. The APOLLON fnal design is about 20 g CO equivalents per kWh of electricity generated. This value,
2
like the EPBT, are within the range of single junction non-concentrating silicon PV modules, and is competitive on the
sustainability front.
FiguRE 85. Comparison of the energy payback times of two commercial CPV systems with starting, optimized and
fnal (ASSE) APOLLON CPV prototypes
75