Page 61 - RSE - Results of the Apollon Project
P. 61
Results of the APolloN PRoject ANd coNceNtRAtiNg PhotovoltAic PeRsPective
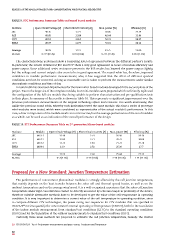
tABLE 9. STC Performance Summary Table on Fresnel based modules
institute Open Circuit voltage [v] Short Circuit Current [A] Max. power [W] Effciency [%]
JRC 48.15 1.277 50.05 24.14
RSE 48.05 1.284 48.64 23.46
UCY 48.53 1.265 50.31 24.27
ENEA 48.39 1.277 50.01 24.12
Average 48.28 1.275 49.75 24.00
St. dev. 0.219 (0.5%) 0.01 (0.6%) 0.753 (1.5%) 0.364 (1.5%)
The characterisations performed show a reassuring level of agreement between the different partner’s results.
In particular, the results obtained at JRC and UCY show a very good agreement in terms of module effciency and
power output. Some additional series resistance present in the RSE results has lowered the power output slightly,
but the voltage and current outputs also seem to be in good agreement. The round-robin has, therefore, improved
confdence in module performance measurements; also, it has suggested that the effect of different spectral
conditions need not be corrected, as long as reasonable care is taken to perform the measurements under similar
atmospheric conditions and time of day.
A round robin has also been implemented for the new mirror-based modules developed in the second phase of the
project. Due to the large size of the complete module, four mini-modules were prepared which suffciently replicated
the confguration of the full size module thus being suitable to perform characterisation and pre-qualifcation tests
in their place. A summary of the results is shown in Table 10. This represents a signifcant improvement over the
previous performance measurements of the original technology optics and receivers. It is worth mentioning that
unlike the previous round-robin, whereby each institution tested the same module, this time a series of prototype
mini-modules were tested, which were considered as representative of the actual module’s performance. In this
case, a direct comparison of the module results is not instructive, but the average performance of the set of modules
as a whole can be used as an indication of the overall performance of the design.
tABLE 10. STC Performance Summary Table on 2 generation Mirror-based modules
nd
institute Module Open Circuit voltage [v] Short Circuit Current [A] Max. power [W] Effciency [%]
JRC MC4-1 12.40 2.74 26.96 28.16
RSE MC4-2 12.89 2.71 28.73 30.00
UCY MC4-2 11.74 2.48 21.74 22.70
ENEA MC4-3 11.9 2.58 25.30 27.7
Average 12.23 2.63 25.68 27.14
St. dev. 0.52(4.3%) 0.12 (4.6%) 2.98 (11.6%) 3.12 (11.5%)
Proposal for a New Standard: Junction Temperature Estimation
The performance of concentrator photovoltaic modules is strongly affected by the cell junction temperature,
that mainly depends on the heat transfer between the solar cell and thermal spread heater, as well as on the
ambient temperature and on the average wind speed. It is a well-recognized experience that the solar cell junction
temperature under light concentration cannot be directly measured by a thermocouple in proximity of the device,
therefore suitable alternative methods have to be developed to get the value of the cell temperature in operating
condition. It is very important to determine a correct value of the cell temperature in operating condition, since
to compare different CPV technologies, the power rating test sequences for CPV modules that are specifed in
IEC62670 need to quantify the concentrator’s normal operating cell temperature (CNOCT), both for the translation
29
of the indoor module measurement from standard test conditions (CSTC) to the standard operating conditions
(CSOC) and for the translation of the outdoor measurements to standard test conditions (CSTC).
Currently, three main methods are proposed to estimate the cell junction temperature, namely: the shutter
29 IEC 62670 Ed.3 –Part 1: Performance measurements and power rating – Irradiance and Temperature.
60