Page 66 - RSE - Results of the Apollon Project
P. 66
Results of the APolloN PRoject ANd coNceNtRAtiNg PhotovoltAic PeRsPective
FiguRE 73. Graph of the solar cell voltage depurated of the series resistance in function of the temperature and for
I= Itherm= 1.5 A
69 Results of the APOLLON project and Concentrating Photovoltaic perspective
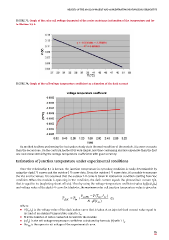
voltage temperature coefficient
FiguRE 74. Graph of the cell voltage temperature coeffcient as a function of the dark current
-0.0030
-0.0035
-0.0040
(V/° C) -0.0045
-0.0050
-0.0055
-0.0060
-0.0065
0.00 0.40 0.80 1.20 1.60 2.00 2.40 2.80 3.20
I (A)
Figure 74. Graph of the cell voltage temperature coefficient in function of the dark current
As the method A allows performing the test under steady state thermal condition of the module, it is more accurate
As method A allows performing the test under steady state thermal condition of the module, it is more accurate
than the second one. On the contrary, the method B is very simple, less time consuming and less expensive of the
than the second one. On the contrary, method B is very simple, less time consuming and less expensive than the frst
first one and allows obtaining the voltage temperature coefficients with good accuracy.
one and allows obtaining the voltage temperature coeffcients with good accuracy.
Estimation of junction temperature in experimental conditions
Estimation of junction temperature under experimental conditions
Once that the relationship β-I is known, the junction temperature in operating condition is easily determinable by
Once the relationship -I is known, the junction temperature in operating condition is easily determinable by
using the dark I-V curves and the outdoor I-V curve data. From the outdoor I-V curve data, it’s possible to measure
using the dark I-V curves and the outdoor I-V curve data. From the outdoor I-V curve data, it’s possible to measure
the Voc and Isc values. It is assumed that the outdoor I-V curve is taken in isothermal condition starting from Voc
the Voc and Isc values. It is assumed that the outdoor I-V curve is taken in isothermal condition starting from Voc
condition. When the module is operating in Voc condition, the dark current equals the photovoltaic current Iph, that
condition. When the module is operating in Voc condition, the dark current equals the photovoltaic current Iph,
is equal to Isc (neglecting shunt effects). Then by using the voltage – temperature coefficient value β C(I)= β C(Isc) and
that is equal to Isc (neglecting shunt effects). Then by using the voltage–temperature coeffcient value (I)= (I sc )
C
C
voltage value of the dark I-V curve for Idark=Isc, the maximum solar cell junction temperature value is given by:
and voltage value of the dark I-V curve for Idark=Isc, the maximum solar cell junction temperature value is given by:
V − V (T , I )
T = T + ocEX in sc (5)
(5)
jEX in
N β⋅ (I )
sc
Where: Where:
• V(T in,I sc) is the voltage value of the dark indoor curve that is taken at an injected dark current value equal to
p V(T ,I ) is the voltage value of the dark indoor curve that is taken at an injected dark current value equal to
in sc
Isc and at an ambient temperature equal to T in;
Isc and at an ambient temperature equal to T in
• N is the number of series connected receiver in the module;
p N is the number of series connected receiver in the module
p (I ) is the cell voltage temperature coeffcient calculated by formula (4) with I=I
• β (I sc) is the cell voltage temperature coefficient calculated by formula (4) with I=I sc
sc sc
p Voc is the open circuit voltage of the experimental curve
EX • Voc EX is the open circuit voltage of the experimental curve.
65
Uncertainty of solar cell temperature value due to current mismatch
CPV module I-V curves can be characterised by typical 'current steps' due to mismatch effects in the presence of
bypass diode. In this case, the solar cells are working in different temperature conditions and the Isc of the module
will correspond to the photovoltaic current value of the “best solar cells”, Iph_max. In the I-V curve of this module it
is possible to identify the value of the current produced by the “worst solar cells”, Iph_min, which is located just on
the left side of the first I-V curve “knee” (see Figure 75).
Applying the procedures previously described, the values Iph-min allows to calculate the lowest junction
temperature value Tj-min, while by using Iph-max it is possible to calculate the highest junction temperature value
Tj-max. Then a temperature range of the solar cell junction can be estimated, given by Tj-min