Page 67 - RSE - Results of the Apollon Project
P. 67
RESuLtS OF thE APOLLON PROjECt ANd CONCENtRAtiNg PhOtOvOLtAiC PERSPECtivE
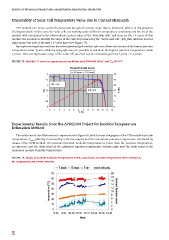
uncertainty of Solar Cell temperature value due to Current Mismatch
CPV module I-V curves can be characterised by typical ‘current steps’ due to mismatch effects in the presence
of a bypass diode. In this case, the solar cells are working under different temperature conditions and the Isc of the
module will correspond to the photovoltaic current value of the “best solar cells”, Iph_max. In the I-V curve of this
module it is possible to identify the value of the current produced by the “worst solar cells”, Iph_min, which is located
right on the left side of the frst I-V curve knee (see Figure 75).
By implementing the procedures described previously, the values Iph-min allows calculation of the lowest junction
temperature value Tj-min, while by using Iph-max it is possible to calculate the highest junction temperature value
70 Results of the APOLLON project and Concentrating Photovoltaic perspective
Tj-max. Then a temperature range of the solar cell junction can be estimated, given by Tj-min
2
FiguRE 75. Module I-V curve in experimental condition with DNI=861 W/m and T =37.6°C
air
Experimental curve
I-V curve P-V curve
3 30
2.5 25
Iph_max
2 20
Iph_min
I (A) 1.5 15 P (W)
1 10
0.5 5
0 0
012345678910111213
V (V)
2
Figure 75. Module I-V curve in experimental condition with DNI=861 W/m and T air=37.6°C.
Experimental Results from the APOLLON Project for junction temperature
Estimation Method
Experimental Results from the APOLLON project for junction temperature estimation
method
The validation of the APM method is represented in Figure 76, which shows the graphs of the CPV module backside
temperature, T , (directly measured by a thermocouple) and the maximum junction temperature estimated by
back
The validation of the APM method is reported in Figure 76, which shows the graphs of the CPV module backside
means of the APM method. The measured module backside temperature is lower than the junction temperature,
temperature, T back, (directly measured by a thermocouple) and the maximum junction temperature estimated by the
as expected, and the daily trend of the estimated junction temperature follows quite well the daily trend of the
APM method. The measured module backside temperature is lower than the junction temperature, as expected,
measured module backside temperature.
and the daily trend of the estimated junction temperature follows quite well the daily trend of the measured module
backside temperature.
Tj max
T air
wind velocity
T back
FiguRE 76. Graph of module backside temperature Tback, maximum junction temperature with method A,
air temperature, and wind velocity 70 20
18
60
16
temperature (° C) 40 12 wind velocity (m/sec)
50
14
10
30
8
20
4 6
10
2
0 0
8:24 9:36 10:48 12:00 13:12 14:24 15:36 16:48
time
Figure 76. Graph of module backside temperature Tback, maximum junction temperature with method A, air
temperature, and wind velocity.
66