Page 69 - RSE - Results of the Apollon Project
P. 69
Results of the APolloN PRoject ANd coNceNtRAtiNg PhotovoltAic PeRsPective
Here follows a report of the results obtained during the frst intercomparison campaign. During intercomparison
clear and cloudy sky conditions were experienced, allowing the evaluation of limitations in data comparison from
a given range of instrument technologies. Spectra acquired from ‘slow’ (monochromator) and ‘fast’ (polychromator)
spectroradiometers are infuenced differently by varying meteorological conditions. For instance, a thin cloud layer
passing quickly close to the sun may, for a polychromator, infuence a few spectra within a measurement window
and can be easily eliminated during post processing, while for a slow spectroradiometer the same conditions may
results in a spectrum distortion in a specifc wavelength region and invalidate the measurement in the time window.
This forced us to set strict acceptance criteria for data validation, based on the irradiance stability within the
acquisition run. For this purpose, data from cavity radiometers, pyrheliometers and/or pyranometers, running
alongside the intercomparison, were used. Irradiance stability during a 4-minute measurement time window had
to be better than1% peak to peak to fag it as ‘stable’ and hence useful for further data analysis. This criterion
excluded non clear-sky and fast rising/falling irradiance situations such as early mornings and late afternoons.
Beside acquisition time, the spectral sensitivity and bandwidth, too, vary among the spectroradiometers involved in
the intercomparison and, therefore, a data reduction (smoothing) function was applied to the acquired data in order
to minimize artifacts when comparing results.
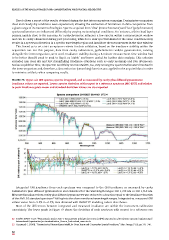
FiguRE 79. Upper: six GNI spectra; spectra integrated, and as measured by cavity plus diffused pyranometer
irradiance values are reported. Lower: spectra deviation with respect to a reference spectrum (JRC-ESTI) and relative
to peak irradiance; plots mean and standard deviation values are also reported
Integrated GNI irradiance from each spectrum was compared to the GNI irradiance as measured by cavity
radiometers plus diffused pyranometers and evaluated for the wavelength ranges 360-1,700 nm or 360-1,050 nm.
Measured irradiance from cavity plus diffused pyranometer was reduced to a fraction equal to the irradiance fraction
32
of the AM1.5G standard spectrum falling into the afore mentioned wavelength ranges. Integrated vs. measured GNI
values varies from –5.9% to +1.5%; data obtained with SMARTS modeling code is also shown.
33
Most of the differences between integrated and measured irradiance are within the instrument calibration
uncertainty. The lower graph in Figure 79 shows the deviation of each spectrum with respect to a reference one
32 ISO/IEC 60904-3 ed.2: “Photovoltaics devices-Part 3: measurement principles for terrestrial (PV) solar devices with reference spectral irradiance data”.
International Organization for standardization, Geneva, Switzerland, www.iec.ch.
33 Gueymard, C. (2001). “Parameterized Transmittance Model for Direct Beam and Circumsolar Spectral Irradiance.” Solar Energy (71:5); pp. 325–346.
68