Page 64 - RSE - Results of the Apollon Project
P. 64
Results of the APolloN PRoject ANd coNceNtRAtiNg PhotovoltAic PeRsPective
The identifcation procedure is based on an iterative algorithm which compares the experimental dark I-V curve
with a mock single-diode curve, under the realistic assumptions that: the ideality factor ranges between 3 and 6; the
dark current I is much greater than the inverse saturation current; in the mock I-V curve R’seq = 0.
Figure 69 shows an example of the ftting procedure used to identify the module parameters and how the model
is able to ft the experimental I-V curve with good accuracy. Once Rseq is identifed, the voltage at the solar cell
junction can be calculated removing from the total voltage the voltage drop on the equivalent series resistance.
DETERMINATION OF THE VOLTAGE-TEMPERATURE COEFFICIENT ß AS A FUNCTION OF THE DARK CURRENT
VALUES
The voltage temperature coeffcient evaluation as function of the current requires detecting several isothermal
dark I-V curves at different temperature values. This can be done either using a climatic cell for temperature
conditioning of the module (Method A) or, alternatively, by injecting a constant current I into the solar cell,
therm
(Method B), which, due to the Joule effect, is heated, and acquiring the voltage decreasing trend as the cell temperature
increases.
METHOD A
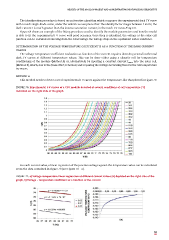
This method needs to detect a set of experimental I-V curves against the temperature, like that plotted in Figure 70.
FiguRE 70. Experimental I-V curves of a CPV module detected at several conditions of cell temperature (°C)
indicated on the right side of the graph
For each current value, a linear regression of the junction voltage against the temperature value can be calculated
From the data contained in Figure 70 (see Figure 78 – a).
FiguRE 71. a) Voltage–temperature linear regression at different current values (A) depicted on the right side of the
graph, b) Voltage – temperature coeffcient as a function of the current
63